ManagementToolbox.com
Innovative Management & Leadership Resources
Division of R. D. Cecil and Company Incorporated 1966
i
| Home | Previous Page |
| Strategic Management & Leadership System ™ |
| Major Innovations | Training Booklets/Manuals | Management Tools |
| Next-Generation Management, Leadership and Organization Development | Psycho-Synergy™ |
| Past Clients | People's Comments | R. D. Cecil Bio | Economic Development | Contact |
[Printable PDF document of this page.]]
Management Tools
(Advanced methods and tools developed for
consultant and client use)
· Integrated Management Systems
· Management, Leadership, and Organization Development
|
|
|
|
|
|
|
|
|
MGM'T EDU'N PROGRAM --> |
|
MANAGEMENT SYSTEM |
|
<-- MANAGEMENT & PLANNING |
|
|
|
|
|
|
METHODS, TOOLS, MATERIALS |
|
|
Complete, fully integrated program: |
|
Unified Practice of |
|
|
|
|
4 books/manuals, 6 booklets; |
|
Management TM System |
|
Checklist of planning steps; |
|
|
5 major innovative models; |
|
|
|
Checklists of factors to analyze; |
|
|
200 instructional exhibits. |
|
Emphasizes planning |
|
List of possible statements |
|
|
Unified Practice of |
|
versus ad hoc |
|
of goals, strategies, tactics; |
|
|
ManagementTM Model |
|
problem solving and |
|
Qualitative Information Base; |
|
|
Knowledge of concepts, methods, |
|
decision making. |
|
Diagrammatic Knowledge BaseTM |
|
|
tools, practices. Skill development. |
|
Emphasizes Team |
|
|
|
|
12 college credits; MBA credits |
|
Approach |
|
. . . and much more |
|
|
|
|
|
|
|
● Improve individual and team per- ● Reduce operational prob- ● Enable managers to deal
formance of management functions lems and conflicts by 20% with 50 to 100 times more
by 50% to 100%. or more. strategic information.
● Improve team (boss-subordinate, ● Help managers save at ● Help identify more
intraunit, and interunit) relation- least 20% of their time. opportunities, threats, and
ships by as much as 100%. problems—and sooner.
This system is a state-of-the-art integration of several innovative knowledge management tools and practices, learning organization practices, general management and leadership concepts and practices, and management and organization development practices—all within a strategic planning (management) context. Some consultants’ methods, tools, and materials have been computerized for greater “do-it-yourself management.” We use these tools to facilitate strategic analysis, planning, and decision-making processes that are computer-assisted from beginning to end.
Most of the following tools are not licensed outright. We generally license them for a client's continued use prior to the consulting engagement during which they will first be utilized on a facilitated basis.
The checklist tools mentioned below are used to perform very detailed zero-base systems analyses (ZBSAs)―i.e., "from scratch" and more improvement- than problem-oriented analyses―within the context of a strategic planning process. Their use results in the development of both qualitative and diagrammatic knowledge bases, which we firmly believe help maximize organizational learning (like a "learning organization on steroids"). The development, use, and benefits of these strategic planning knowledge bases are described in the book, Next-Generation (approach to) Management, Leadership, and Organization Development. [Click here to go to the book's page on this website.]
MANAGEMENT, LEADERSHIP, AND ORGANIZATION DEVELOPMENT
The methods and tools listed below help guide an organization through a (diagrammatic) analysis of how numerous internal/organizational and external factors are interacting with and upon each other, and, as a result, are influencing motivation, attitudes, interactions, task behavior, and performance within all major levels and groups of an organization. This process is exceptionally powerful and helps generate many insightful organizational and human resources plans and solutions.
74-page Index (6-level spreadsheet outline/checklist) of Major Socio-Technical/Cultural Factors that influence motivation, attitudes, behavior, interactions, and performance within an organization. This index is essentially an organizational behavior taxonomy or a Dewey Decimal System type of categorization of socio-technical or cultural factors. It is like having an "organizational behavior expert on a disk." When filled in during a strategic planning (zero-base systems) analysis, it constitutes an "Organizational Behavior Qualitative Information Base" of mostly tacit information.
A methodology for (using the checklist and) diagramming the analysis of organizational systems, structures, and attitudinal and behavioral phenomena. Like Systems Analysis approaches, this diagram depicts structures and flows of information, materials, and services (etc.). However, it also shows how socio-technical/cultural factors are influencing structures, flows, motivation, attitudes, task behavior, interdepartmental interactions, and performance throughout the organization. [Once such a diagram is computerized, it becomes a "diagrammatic knowledge base" or DKB.]
Various designs of a TeamThink WallTM [diagramming surface of 160 to 256 (or more) square feet] Several designs enable long-range analyses of internal and external systems of factors.
MARKETING AND STRATEGIC PLANNING
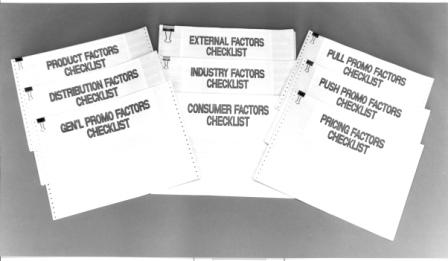
186-page, Index (8-level spreadsheet outline/checklist) of Industry, Marketplace and Marketing Mix Factors (a “marketing meta-construct” of approximately 3,500 variables): industry structure, competitors, practices — 45 pages; products (or services) — 26 pages; consumer demographics, attitudes, behavior — 26 pages; distribution channels — 18 pages; general, push, and pull promotion — 61 pages; pricing — 17 pages; and competitive strengths and weaknesses checklist — 13 pages. This index is essentially a marketing taxonomy or a Dewey Decimal System type of categorization of marketplace-related factors. It is like having a "marketing expert on a disk." Although this checklist is primarily an analytic tool for performing very detailed "zero-base marketing (systems) analyses," especially during strategic planning processes, it also provides a framework for developing a “Marketing Qualitative Information Base" of mostly tacit information harvested from participants' minds. (Sub-checklists are pictured below.)
126-page Index (spreadsheet outline/checklist) of External/Outside Forces and Factors that will tend to affect an industry and/or given organization over time (a “business environment meta-construct”). Is based on our extensive files concerning (a) factors, phenomena, and trends in numerous technological areas; (b) phenomena, events, and trends in numerous industries; (c) economic factors, phenomena, data, and trends; (d) socio-cultural factors, phenomena, data, and trends; (e) governmental factors, phenomena, and trends; (f) international factors, phenomena, and trends; and (g) environmental factors, phenomena, and trends; etc. This index is essentially a business environment taxonomy or a Dewey Decimal System type of categorization of factors external to an organization. Along with the marketing checklist described above, it is used to perform very detailed "zero-base industry/marketplace/business environment systems analyses"―especially during strategic planning processes. (This sub-checklist is pictured below at the top of the middle group.)
A methodology for developing a wall-size diagram of a company's entire Industry/Marketplace and Business Environment Analysis (the many factors or variables, their relationships, and associated key data). [Once such a wall diagram is computerized, it becomes a "diagrammatic knowledge base" or DKB.]
A four foot by eight foot diagram of (projected) phenomena occurring over the next twenty years in various areas: technologies; industries; government; the economy; the culture; etc. The model is a condensed, visual version of (a) the External Forces/Factors Checklist mentioned above, and (b) information compiled over approximately thirty years.
A 300-page Planning Manual on the analysis, goal-setting, planning, budgeting, and decision-making functions involved in strategic/long-range planning, annual planning, and (ad hoc) problem solving and decision making.
A (computerized) 72-page Checklist of Strategic/Long-Range Planning Steps (both methodological and organizational steps)—a four-level outline of steps and sub-steps, tips, suggestions, and references to pages in the printed planning manual that explain “how to.”
A (computerized) 50-page List of Possible Statements of Objectives, Strategies and Tactics for a company and its major units. It enables drag-&-drop development of a goals/plans document.
A methodology and a TeamThink WallTM design for diagramming an entire “time-lapse industry, marketplace, and business environment analysis” (as a basis for strategic/long-range planning scenario analysis).
A computer template for “automatically” integrating program/project budgets into consolidated corporate pro forma financials. (Under development.)
A method for performing strategic/long-range planning using a net present value analysis (to evaluate alternative sets of strategies and plans/budgets of the major organizational units).
100-page, Index (spreadsheet outline/checklist) of Financial Factors (a “meta-construct” of many financial variables): main financial factors — 64 pages; industry financial factors — 12 pages; financial laws and regulations — 6 pages; external financial entities and forces — 11 pages; financial ratios (with built-in spreadsheet calculators) — 6 pages; and (statements of) alternative goals and objectives — 2 pages. This index is essentially a financial taxonomy or a Dewey Decimal System type of categorization of financial variables. It is like having a "financial expert on a disk." Although this checklist is primarily an analytic tool for performing very detailed "zero-base financial (systems) analyses," especially during strategic planning processes, it also provides a framework for developing a “Financial Qualitative Information Base" of mostly tacit information harvested from participants' minds.
45-page (at present), Index (spreadsheet outline/checklist) of Operations/Production Factors (a “meta-construct” of many production variables): product-related factors — 36 pages; competitors' facilities factors — 2 pages; company facilities — 2 pages (for now); and task-related/technological factors — 5 pages. This index is essentially a production taxonomy or a Dewey Decimal System type of categorization of operational variables. It is like having an "operations/production expert on a disk." Although this checklist is primarily an analytic tool for performing very detailed "zero-base production (systems) analyses," especially during strategic planning processes, it also provides a framework for developing a “Production Qualitative Information Base" of mostly tacit information harvested from participants' minds.
The following are tools for collecting, validating, formatting, diagramming, sharing, storing, and using information.
Marketing Qualitative Information Base
The computerized 186-page, 8-level Index (outline/checklist) of Industry, Marketplace and Marketing Mix Factors described above, while an analytic tool, is also a framework for developing this database of tacit (mostly qualitative or subjective) information harvested from team members' minds.
Marketing Diagrammatic Knowledge BaseTM
A computerized 160 to 256+ square foot, company-specific Industry, Marketplace, and Business Environment Diagram—complete with pop-up maps and graphs of data associated with the diagrammed entities, variables, phenomena, and their relationships—that can serve as an interface to access data from additional sources. (Basic pre-drawn templates for the healthcare and energy/utilities industries are under development.)
Production/Operations Qualitative Information Base
The computerized 45-page Index (outline/checklist) of Production/Operations Factors described above, while an analytic tool, is also a framework for developing this database of tacit (mostly qualitative or subjective) information harvested from team members' minds.
Production/Operations Diagrammatic Knowledge BaseTM
A computerized 160 to 256+ square foot, company-specific Production/Operations System Diagram—complete with pop-up graphs of data associated with the diagrammed variables, phenomena, and their relationships—that can serve as an interface to access data from additional sources.
Financial Qualitative Information Base
The computerized 100-page Index (outline/checklist) of Financial Factors described above, while an analytic tool, is also a framework for developing this database of tacit (mostly qualitative or subjective) information harvested from team members' minds.
Organizational Behavior Qualitative Information Base
The 74-page Index (outline/checklist) of Major Socio-Technical/Cultural Factors mentioned above, when filled in, constitutes an “Organizational Behavior Qualitative Information Base” of tacit information harvested from participants' minds.
Organizational Behavior Diagrammatic Knowledge BaseTM
Such a knowledge base is the result of diagramming a checklist-assisted (zero-base) analysis of organizational systems, structures, and attitudinal and behavioral phenomena. Like Systems Analysis approaches, this diagram depicts structures and flows of information, materials, and services (etc.). However, it also shows how socio-technical/cultural factors are influencing structures, motivation, attitudes, task behavior, intra- and inter-departmental interactions, input/output flows, and performance throughout the organization.
significantly improve managers' and leaders' think-work processes
TEAM THINKING & LEARNING CENTERS
Various possible designs of a TeamThink WallTM (diagramming surface) for analysis, problem-solving, decision-making, and strategic/long-range planning purposes.
We have been diagramming complex industries, organizations, and situations on specially constructed walls ever since 1976―years before the terms "mind mapping," "influence diagrams," "information visualization," and "information architecture" were coined. Our earliest “wall” (1976) was 160 square feet. The largest wall to date was 256+ square feet (32' wide by 8' to 10' high). It had hundreds and hundreds of objects on it―entities, factors/variables, their cause-effect or sequential relationships, and key bits of data associated with them. Such a wall model is a visual summary and integration of large amounts of both qualitative and quantitative information.
Developing a huge diagram of a TeamThink WallTM (pictured below) helps a group deal with the complexities of a real-world situation visually. It enables analysts, planners, decision makers, and policy makers to handle (make sense of, interrelate, and brainstorm) at least 50 to 100 times more information during think-work processes. Because the most strategically significant information is on the wall right in front of them, and because they have helped develop everything on the diagram from scratch, they need not try to juggle it all mentally. [Remember Miller's "Magical number seven (factors mentally manageable at a time), plus or minus two."] This leaves their minds free to analyze, sequence, interrelate, and/or integrate many bits of information more easily and effectively, to be more insightful and creative, and to better recognize what's going on, why, and what to do about it. [Developing a DKB involves "information visualization architecture or design."]
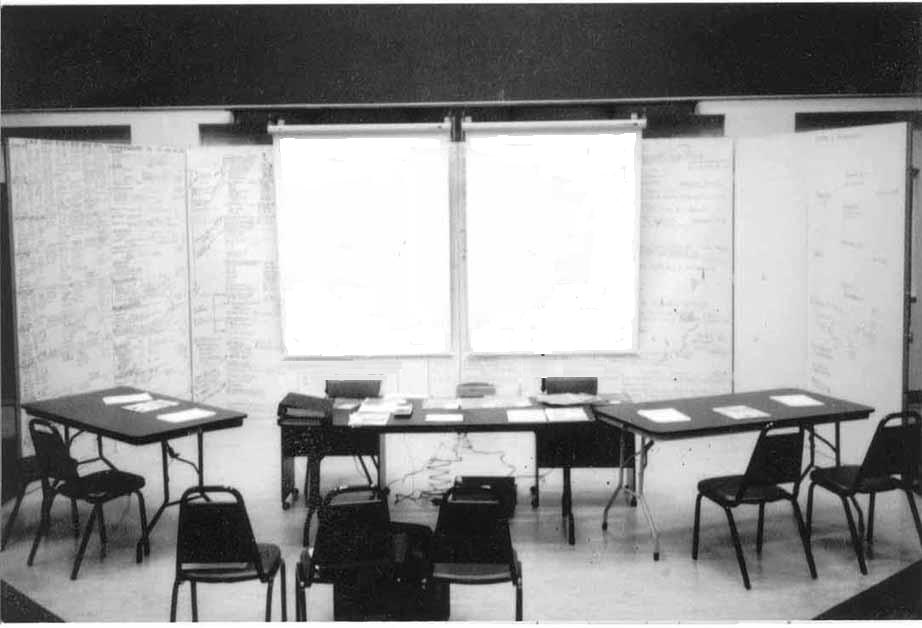
The above 256 square foot wall contains an Illinois county's
1992 Long-Range Economic Development Planning analysis. We
use this example because we do not make public our business
clients' strategic planning DKBs (diagrammatic knowledge bases).
Diagrammatic knowledge bases (DKBs) can illustrate and contain both qualitative and quantitative information regarding, for example:
entities and variables operating in a company's industry, marketplace, and external business environment;
the operational, intelligence, and logistical activities or phenomena occurring throughout an entire theater of military operations; or
how socio-technical/cultural factors are influencing the motivation, attitudes, behavior, activities, interactions, flows of task-related inputs and outputs, and performance both within and between organizational levels and units.
One design aids in performing a “time-lapse environment-business scan” for long-range planning purposes (i.e., for analyses of scenarios).
A hardware/software system for projecting a Diagrammatic Knowledge Base (a computerized wall diagram of, for example, one of the three items above) onto a rear projection wall―real time, seamlessly, and in its entirety in the type of strategic planning warroom pictured above, so that it can be used and modified interactively. The rear projection wall is not just one screen or a series of monitors, but a whole "continuous wall." [Using our design, a 256 square foot rear projection wall can be constructed for about $15-000 to $35,000 (depending on configuration)!]
Contact Information:
TeamThink SystemsSM
Division of R. D. Cecil and Company
1151 Middle Road — Suite B
Dixon, Illinois 61021-3904
Sales and Support
Telephone:
1-815-312-2571
Hours: 10:00 A.M. to 5:00 P.M. Central (Chicago) Time, Monday through Friday
Fax: as above, but call ahead
E-mail: rdc1@rdcecil.com
Copyright © 2024 by R.D. Cecil and Company Last updated: 8/01/2024
|
|